 |
 |
 |
Family and Children's Resource Program
![]()
Vol.
16, No. 2
April 2011
CPS Intake in North Carolina: by the Numbers
To get a sense of just how important child protective services (CPS) intake is to the child welfare system, let’s look at the numbers.
NC’s WorkForce
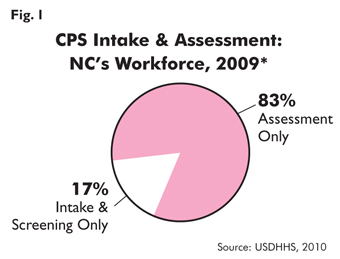
In federal fiscal year (FFY) 2009, North Carolina’s 100 county departments of social services employed 990 staff involved in CPS intake and assessment: 167 whose primary role was CPS intake/screening and 823 whose primary role was conducting CPS assessments (USDHHS, 2010).*
NC’s approach to CPS staffing is consistent with other states that use an alternative CPS response. A 2005–06 survey found 71% of agencies in these states had workers routinely conduct both screening/intake and alternative response (Westat, 2009).
Referrals
When someone contacts a CPS agency to allege a child has been maltreated, it is called a referral. During FFY 2009, an estimated 3.3 million referrals were received by CPS agencies nationwide (USDHHS, 2010).
In our state, CPS referral data is collected from an annual staffing survey, which asks county DSS agencies how many referrals they receive each month between June and November. Based on this, we estimate that in 2009 there were about 119,000 CPS referrals in NC, or about 9,900 a month statewide (Stewart, et al., 2011).
Screening
If a referral meets the definition of abuse, neglect, or dependency as these terms are defined in NC’s General Statute 7B-101, the referral is “screened in,” meaning it
becomes a report and the agency conducts an assessment to ensure the safety of the child(ren). If a referral does not meet the state standard it is “screened out.”
Compared to the rest of the country, CPS referrals in North Carolina are somewhat more likely to be screened in. In FFY 2009, CPS agencies in the U.S. screened out 38% of referrals (USDHHS, 2010). In 2009, approximately 31% of North Carolina child maltreatment referrals were screened out (Stewart, et al., 2011).
Since 31% is a statewide average, the screen-out rate was above or below this in most counties. Although rates outside the norm can be warranted, every county DSS should monitor its screen-out rate and try to understand why it is what it is, and to make changes if needed to ensure full compliance with law and policy.
Reports
Over the last ten years the average number of CPS reports received monthly in North Carolina has increased slightly. In SFY 2009-10, CPS agencies received 68,735 reports of child maltreatment concerning 124,894 children (Duncan, et al., 2011).
The volume of CPS reports fluctuates throughout the year in North Carolina. Typically, the number received monthly peaks around May, falls in June and July, rises slightly through October, then declines through December (Stewart & Duncan, 2010).
Report Sources
Though reporter information is confidential, North Carolina collects demographic data about the people who call a CPS agency to allege child maltreatment.
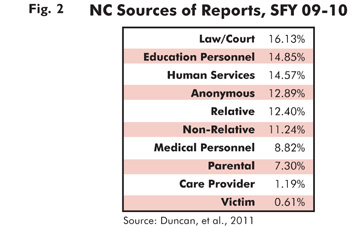
The pattern of reporting shown above is typical: most reports come from those who encounter the alleged victim as part of the report source’s occupation. In SFY 2009-10, 56% of reports in NC came from professionals.
In the last ten years the annual percentage of reports received in NC from human services professionals has declined slightly, from 16.6% of all reports in SFY 1998-99 to 14.6% in 2009-10. Meanwhile, the percentage of reports from law/court professionals increased from 10% in SFY 1998-99 to 16% in 2009-10 (Duncan, et al., 2011). This rise is consistent with a national trend: the percentage of U.S. CPS agencies who said law enforcement was their most common source of reports rose from 7% in 2002 to 23% in 2005-06 (Westat, 2009).
CPS Assessment Tracks
Once a report is accepted, CPS intake staff determine whether to respond with an investigative assessment or a family assessment. They choose whichever CPS approach will best provide for the child’s safety, permanence, and well-being. However, agencies must respond to all reports of abuse and certain types of neglect reports—such as those involving a child fatality or where there is medical neglect of a disabled infant—with the investigative track. For most types of neglect and all dependency reports, the family assessment response should be used.
In SFY 2009-10, CPS agencies in North Carolina used the family assessment approach about 75% of the time (Duncan, et al., 2011).
Response Times
After a report is accepted, the law requires CPS to make face-to-face contact within a certain time period with all children living in the home. Response times vary by report type: the response must be initiated within 24 hours for abuse and 72 hours for neglect. Some types of neglect reports, such as those in which a child has received injuries, require a response within 24 hours. If a report is deemed high risk, the response must be immediate.
In North Carolina’s 2007 federal Child and Family Services Review, CPS response time was rated as an “Area Needing Improvement.” Reviewers found agencies initiated a CPS assessment in accordance with the required time frames 81% of the time, less than the 90% required for a “Strength” rating (USDHHS, 2007).
CPS Findings
Findings of an investigative assessment are classified as either substantiated or unsubstantiated. As Figure 3 shows, substantiations of abuse, neglect, abuse and neglect, and dependency in North Carolina have declined since 2001.
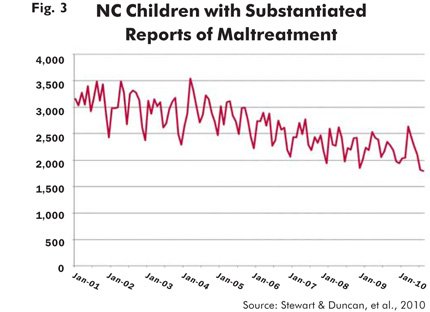
The decline generally corresponds to the start of the Multiple Response System (MRS), which introduced the family assessment response and, with it, four new CPS findings:
• Services needed
• Services provided, protective services no longer needed
• Services recommended
• Services not recommended
Unsubstantiations have also decreased since 2001. This decline is likely due to a decrease in the number of investigative assessments and the growth in family assessments (Stewart & Duncan, 2010).
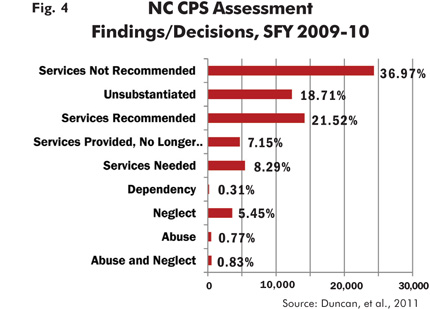
Over the last ten years the profile of CPS findings in North Carolina has changed. After the expansion of MRS statewide in 2006, the number of findings of “services recommended” has continued to grow, meaning that more families and children are being recommended for services, over and above the number of children determined to be victims of maltreatment (Stewart & Duncan, 2010).
This may be a good thing. A recent evaluation of MRS (Duke, 2009) found that families who received more frontloaded services during the CPS assessment phase were less likely to return to the attention of CPS in the next six months.
Curious about Your County’s Performance?
Consult the “Management Assistance” site http://ssw.unc.edu/ma/, which is maintained by the UNC-CH School of Social Work in partnership with the NC Division of Social Services.
References for this and other articles in this issue
* This information about NC's intake workforce was revised on 1-8-15 to correct a data interpretation error.