 |
 |
 |
©
2011 Jordan Institute
for Families
![]()
Vol.
16, No. 3
July 2011
Adoption in North Carolina: by the Numbers
Ensuring all children have a loving, safe, and permanent family is a core goal of the child welfare system. The following data tell us something about how well our state is doing in pursuit of this goal.
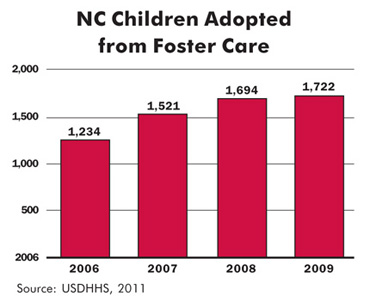
How many children are adopted from foster care in NC?
As Figure 1 illustrates, over the last several years North Carolina has steadily increased the number of children adopted from foster care. Adoption also made up a growing percentage of the exits from foster care each year since 2006. In that year 22.4% of the NC children who left foster care were adopted; by 2009 that percentage climbed to 29.2% (USDHHS, 2011).
How many young people in foster care in NC await adoption?
The federal government reports that in 2009 there were 1,470 North Carolina children in foster care awaiting adoption (USDHHS, 2011). Typically counts of waiting children reported by the NC Division of Social Services are lower; on May 16, 2011, it reported that 769 of the children in foster care in NC were awaiting adoption. The discrepancy is due to the fact that the federal government includes in its count all children with a goal of adoption, even if parental rights have not yet been terminated. North Carolina’s count includes only children who have the goal of adoption and are legally free.
How long is the wait?
In calendar year 2010, the average length of stay for children adopted from foster care in North Carolina was 27.5 months, well below the national median of 32.4 months. During 2010, length of stay in
foster care was shortest for adopted children from large counties (25.6 months), longer for children from mid-sized counties (28.6), and longer still for children from small counties (29.5 months) (Duncan, et al., 2011).
In SFY 2010, 33.2% of North Carolina children who left foster care through adoption were adopted within 24 months of their last entry into care (Duncan, et al., 2011). This is one of the key REAP “Achievements” North Carolina uses to track its performance related to adoption. Our state has improved on this performance measure every year since 2006 (USDHHS, 2011).
Gender. Of the NC children adopted from foster care in SFY 2009-10, 48% were female and 52% were male (Duncan, et al., 2011).
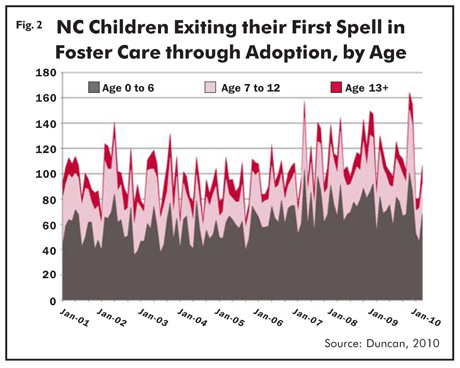
Age. As Figure 2 shows, most NC children who leave foster care through adoption are age six or younger. Between January 2001 and March 2010, an average of slightly more than 64 children age birth to six were adopted from foster care each month. During this same period about 28 children age seven to 12 and about 11 children age 13 and older were adopted from foster care each month. These are averages; the actual number of adoptees in each group varies each month (Duncan, 2010).
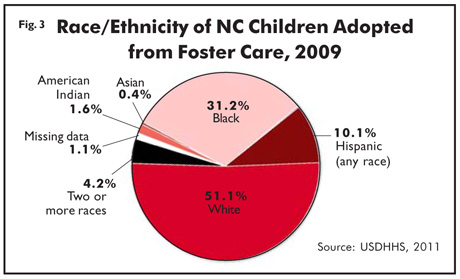
Race. Figure 3 describes the race of the children adopted from foster care in 2009. The percentage of adopted children from each group is typical for the past several years (USDHHS, 2011).
Disability. Children with a diagnosed disability make up an increasingly greater percentage of the NC children adopted from foster care. In 2006, 18.1% of children adopted from foster care in our state had a diagnosed disability; in 2009 that rose to 25.5% (USDHHS, 2011).
Who adopts children from foster care?
Most children in foster care in NC are adopted by their foster parents. Of the children adopted in Federal Fiscal Year 2005-06, 54% were adopted by foster parents. The rest were adopted by relatives (23.3%), non-relatives (22.6%), and step-parents (0.1%) (USDHHS, 2008).
How many children are adopted each month?
As Figure 4 shows, approximately 100 NC children are adopted from foster care each month, although the actual number fluctuates considerably. For example, in January 2007 there were 77 adoptions, while in November 2009 165 children were adopted.
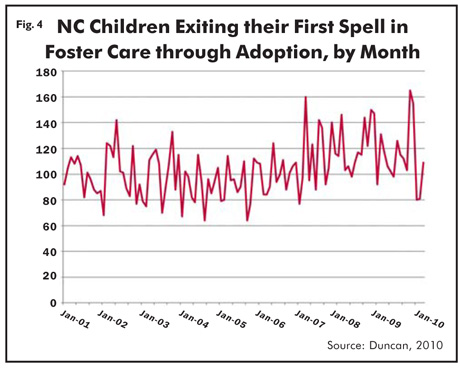
The data suggest that the rate of adoptions in North Carolina is seasonal. Adoption numbers tend to be low in January and February and higher in May and June. There also appears to be an increase in October and November each year (Duncan, 2010). This pattern may reflect a push in May and June to finalize as many adoptions as possible before the state fiscal year ends on June 30, as well as an effort to finalize adoptions in October and November before the federal reporting (AFCARS) ends each year on November 15. Also, to avoid school changes, some social workers may wait until summer to place children—these adoptions would be finalized in the fall.