 |
 |
 |
©
2004 Jordan Institute
for Families
![]()
Vol.
9, No. 4
July 2004
Using Data-Based Newsletter to Engage Staff, Others Around Child Welfare Outcomes
It is hard for people to act on information they do not understand or value. Therefore, agencies that want outcomes data to have a positive influence on child welfare practice must put that data in the hands of frontline staff and other stakeholders, and they must do so in a way that is timely, relevant, and clear.
This can be a difficult task. Learning to do this in your agency can be easier when you have a good model to follow. For this reason, we present the following discussion of the data-based child welfare newsletters produced in connection with Family to Family initiative activities in Wake and Guilford Counties.
From
Resistance to Ownership
CJ Harper was up against it. Early 2002, when she began her work with
the child welfare division of Wake County Human Services, she was not
well received. “I heard things like ‘outsider,’ ‘spy,’
and ‘hotshot-know-it-all,’” she recalls.
Her problem was that, as a planner and data analyst with no background in children’s services, Harper was seen as an outsider by frontline staff in her office. Child welfare workers saw her efforts to help them work with data as intrusions that would only lead to more work for them. They didn’t see the connection between their work with families and capturing, analyzing, and talking about data.
Today, Harper says, it’s a different story. “Now, if I’m a few days late with an outcomes report, people come up to me and ask, ‘Where’s my data?”
What accounts for this transformation? Harper says that after meeting initial resistance, “I fell back and tried again.” With the help of her agency’s self-evaluation team (SET) she took an inventory to assess people’s satisfaction and comprehension of data to see how they were using it. After looking at the results, she and the SET revised the way they presented data.
Harper also used a different interpersonal approach. “I approached people by saying, ‘This is YOUR data. It is what you’ve been collecting all along, and we are not asking you to do anything different. We’re just going to look at it in a different way.’”
After that, she found it wasn’t a hard sell. “People want to see the impact of what they are doing.”
Wake
County
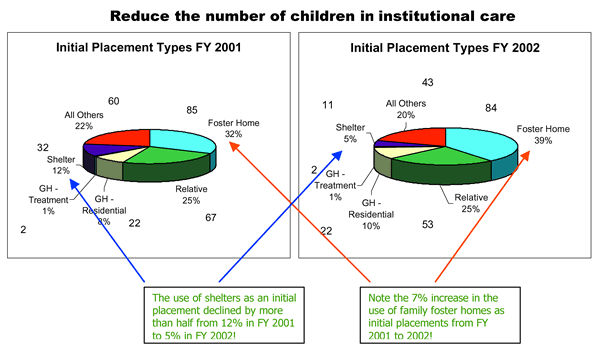
Wake’s data summary appears once a quarter. It is simple and unpretentious:
two or three photocopied sheets featuring tables, bar charts, and line
drawings (click here
for a sample). Each deals with an important child welfare outcome,
such as reducing racial disparities in the foster care population. There
is minimal commentary on the figures.
The simplicity of the presentation is part of this data newsletter’s accessibility. It is also part of what encourages people to use it: by not commenting on the information, it leaves the task of interpretation to readers.
The way the data summary is disseminated says a lot about Wake’s commitment to self-evaluation, openness, and accountability. An electronic version is sent to all agency staff, who are encouraged to share it with anyone they wish. Hard copies are posted on bulletin boards in several spots throughout the agency—including the client waiting room—and mailed to vendors and community stakeholders, such as leaders in the faith community.
In addition, the agency’s community outreach workers incorporate child welfare outcomes information from the newsletter into their quarterly presentations to partner agencies (e.g., the police). Copies of Wake’s data summary are also shared with the agency’s vendors, such as those who provide contract foster care services.
Harper and the SET create the newsletter using a variety of sources, including local placement data and longitudinal data from the NC Division of Social Services. Harper uses SPSS software for the statistical analysis and formats the newsletter using Powerpoint and Access.
Guilford
County
Guilford County’s newsletter is produced by Joy Stewart, the agency’s
evaluation coordinator. Like Harper, Stewart works closely with Guilford’s
self-evaluation team (SET), draws from local and statewide data for her
analyses, and uses similar software. (See below for an example of the
Guilford newsletter. The following Guilford Family to Family newsletters
are also available as examples: January
2003, January 2004, and April
2004.)
Despite the accessibility
of Guilford’s newsletter, Stewart concedes that it can still be a
challenge to get people to make connections between child welfare practices
and outcomes. But she says that, based on the number of requests for data
she receives from individual workers and supervisors, it is happening.
Stewart also notes that the newsletter is useful during difficult conversations.
“When you start talking about sticky issues such as race, having
something as objective as data takes some of the sting out of the discussions
and gets people talking about the issue.”
One of Guilford’s next major goals is to begin tracking quality of life outcomes (such as educational attainment, employment, and general life skills) for former foster youth. “I am quite excited,” Stewart says. “I believe this shows how far our agency has progressed in the self-evaluation process.”
Lessons
Learned
Presenting data in a way that interests and engages frontline staff is
no easy task. Here are some key ingredients you will need to succeed:
- Buy-in from management.
Your overall organization—especially the director—needs to
believe in using outcome data to assess and drive practice.
- Reliable data. You can’t
base decisions on unreliable data. To obtain reliability you need to
share ownership of the self-evaluation process with ALL your data handlers.
- A data translator. To practice
self-evaluation and work with data you need someone on staff with the
desire and, if not the skills, at least the capacity to learn statistical
analysis.
- A Self-Evaluation Team that includes child welfare supervisors and front line staff helps focus analyses, interprets data, and adds credibility to the process.
If you are interested in creating a newsletter similar to the ones described in this article, contact Caroline.Harper@co.wake.nc.us or jstewar1@co.guilford.nc.us
|
A Model of Clear Communication
|